

 by Tom Gurney
Tom Gurney BSc (Hons) is an art history expert with over 20 years experience
Page Created on September 22, 2026 / Page Updated on September 22, 2026
Email: tomgurney1@gmail.com / Phone: +44 7429 011000
A Map of Imola
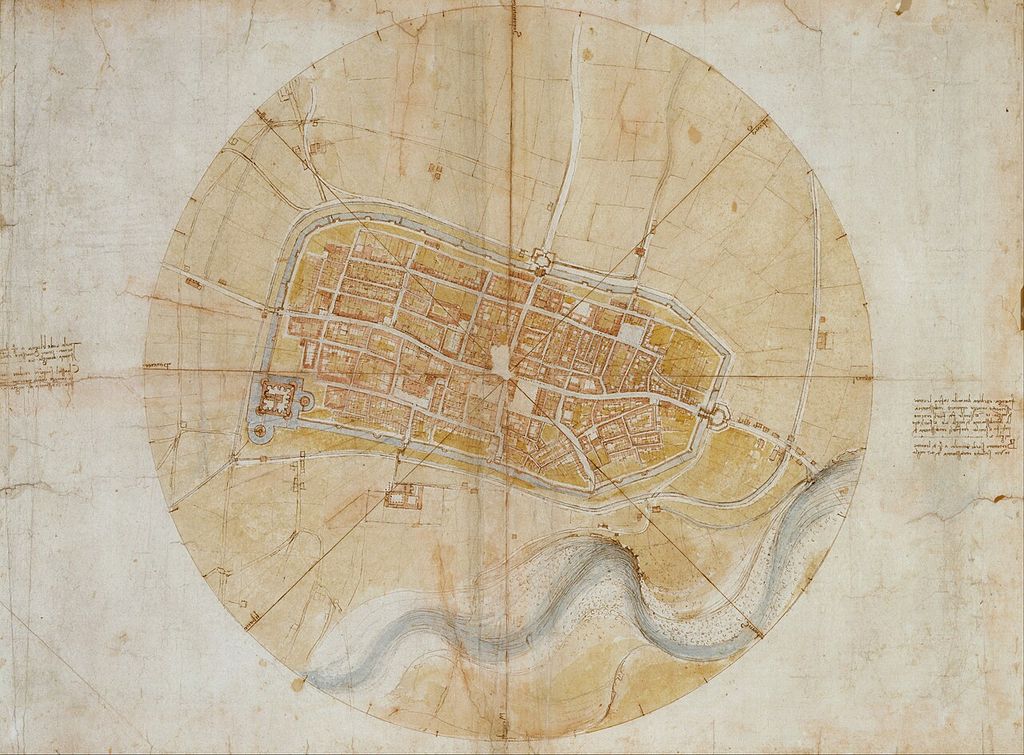
Leonardo da Vinci's map of Imola gives the immediate impression of a city seen from directly overhead. Streets form a pale network inside a ring of walls; blocks fill the spaces between; the fortress projects from one edge; roads and the River Santerno extend into the surrounding land. A circle and radiating directions organise the entire sheet. Because the image resembles a modern street map, it is often described as “satellite-like”. The resemblance is striking, but the phrase hides the achievement. Leonardo never occupied an aerial viewpoint. He constructed the city from measurements taken on the ground, incomplete working notes and deliberate graphic choices.
The finished map, Royal Collection Trust RCIN 912284, dates from 1502 and measures 44 by 60.2 centimetres. Its materials—black chalk, incised stylus lines, pen and ink, and coloured washes—preserve stages between geometric construction and presentation. A second Royal Collection sheet, RCIN 912686, contains measured sketches of Imola's streets and quarters. Read together, the two works show that the famous overhead image was neither a freehand view nor a mechanically perfect survey. It is a designed synthesis of fieldwork, calculation, local information and visual intelligence. [1] [2]
At a Glance
- SubjectA Map of Imola
- Artist and contextLeonardo da Vinci (1452–1519) and his Renaissance world
- Period1502
- ImageLeonardo's map of Imola.
Where this study sits in Leonardo’s career
Contents
- Leonardo in Cesare Borgia's Romagna
- The finished object
- From dimensions to an overhead city
- Measurement did not eliminate design
- The Rocca and the logic of defence
- Was it made from an older map?
- Later images make Leonardo's choice visible
- A map rediscovered through reproduction and local scholarship
- The map as a tool of power
- A measured city, deliberately composed
Leonardo in Cesare Borgia's Romagna
In 1502 Leonardo entered the service of Cesare Borgia, son of Pope Alexander VI and commander of papal forces. Borgia had seized a group of territories in central Italy and needed to inspect, defend and administer them. A letter patent issued on 18 August names Leonardo as architect and engineer, orders officials to give him free passage, and requires men and assistance to be supplied for his examinations and measurements of strongholds. [3]
The document establishes authority and scope. It does not specifically command the making of the Imola sheet. Leonardo's surviving pocket notebook, Manuscript L at the Institut de France, traces a journey through Urbino, Pesaro, Rimini, Cesena, Cesenatico, Faenza and other places. He recorded walls, ports, waterworks, buildings, bearings and distances. Mapping belonged to a broader reconnaissance in which military engineering, logistics and territorial knowledge overlapped. [3]
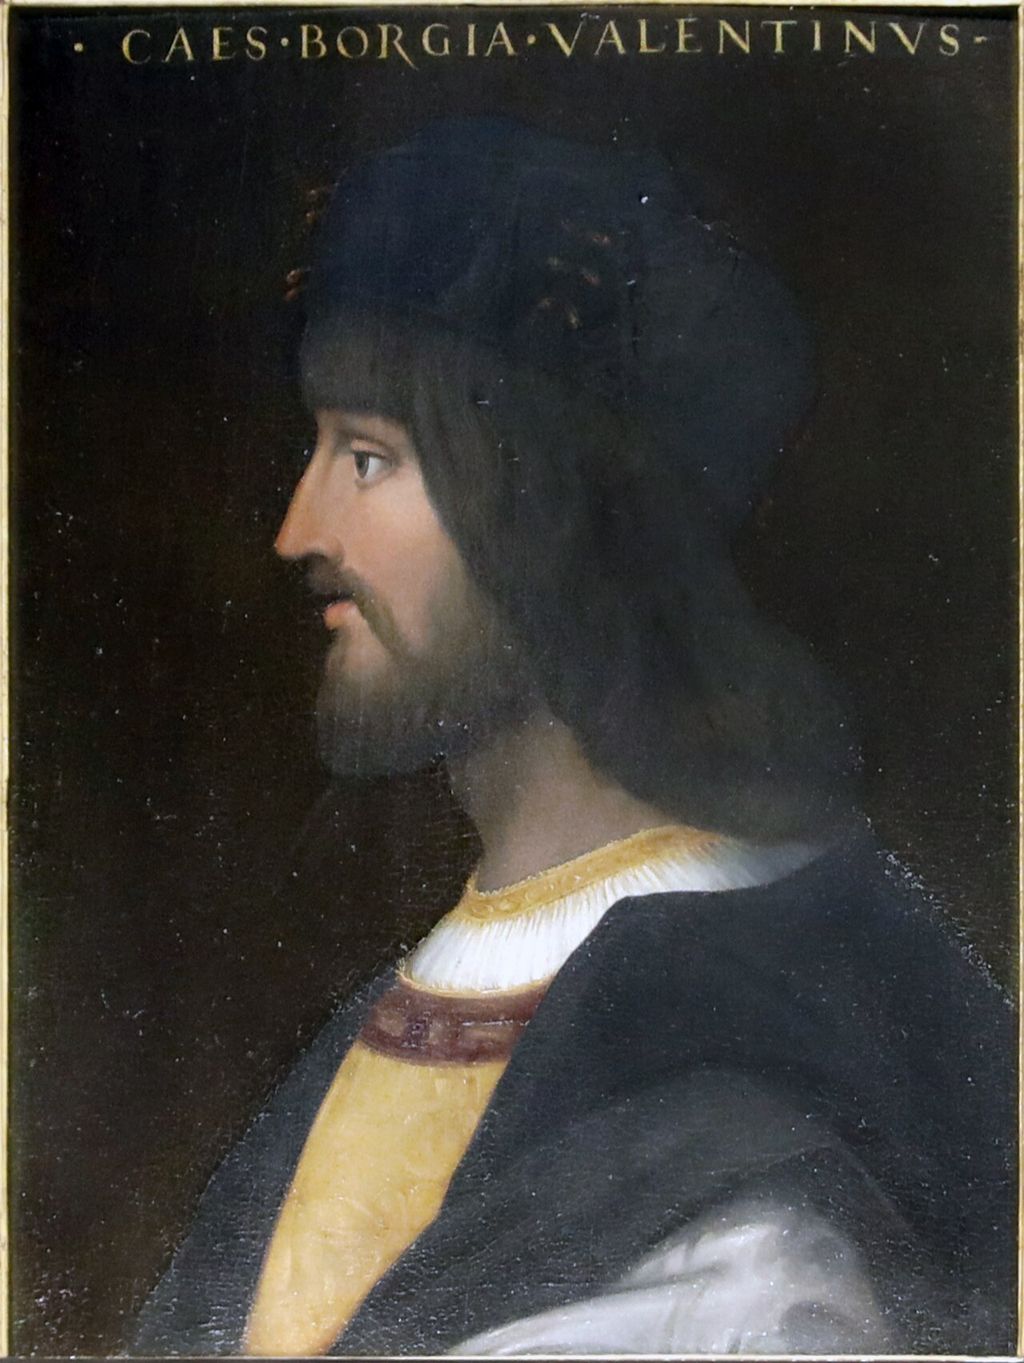
Leonardo reached Imola in the autumn and remained there into December. The city was a northern outpost of Borgia's Romagna and a military concentration point during pressure on nearby Bologna and its ruler, Giovanni Bentivoglio. Troops, weapons, gates, roads, walls and the fortress all mattered. Niccolò Machiavelli was also in Imola as a Florentine envoy, reporting Borgia's negotiations and manoeuvres, although the surviving evidence does not establish a working partnership between him and Leonardo. [3] [9] [13]
The map's likely value follows from this setting. A commander or administrator could see routes through the city, relation of gates to streets, position of the Rocca, shape of the defensive perimeter and approaches beyond it. The sheet could support discussion of fortification, movement, billeting or intervention. Its exact intended task and audience are not documented, so “military-administrative plan” is safer than a story in which Borgia orders this particular map for one known campaign.
The finished objectThe city is enclosed in a circle larger than the wall circuit. Four strong diameters divide that circle into eight principal directions, named with the traditional winds: north, north-east, east and their counterparts. Finer divisions create sixty-four directional units. Leonardo wrote the wind names in his habitual mirror script. [5]
South is at the top, so the map appears rotated to viewers accustomed to north-up convention. Rotation does not indicate error. Early maps could be oriented in several ways according to purpose, route, coast, patron or compositional need. Here the wind framework supplies direction independently of a modern page convention.
Within the walls, broad pale streets separate warm-toned blocks. The principal east-west axis bends through the city rather than forming a rigid line. Gates puncture the perimeter. The Rocca Sforzesca is rendered with unusual detail: its corner towers, court, defensive works and external elements make it immediately legible as the city's concentrated military structure. Some of the walls and ravelins shown were changed or demolished in later centuries, so comparison with today's Imola must account for physical transformation as well as mapping error. [5] [11]
The countryside is handled differently. Roads extend outward; water, banks and the Santerno's meanders receive fluid washes and drawn marks. The dense, bounded organism of the city contrasts with the open landscape. This is not a neutral difference of data density. Graphic hierarchy tells the viewer what kind of thing each area is and directs attention towards the urban enclosure.
A second sheet records work on the ground
RCIN 912686 is less visually impressive but more revealing about procedure. It contains four schematic groups corresponding to Imola's quarters—San Matteo, San Cassiano, San Giovanni and Sant'Egidio—along with the Rocca and gates. Street and block lengths are written beside simplified paths. The folded sheet was worked in sections, so the four plans have different orientations rather than forming one continuous small map. [2] [5]
Measurements were taken along segments between the centres of street intersections. This method reduces an irregular street network to a connected skeleton. A surveyor can walk or otherwise measure one interval, note its length, then proceed to the next. Curves and changing widths become a chain of manageable units.
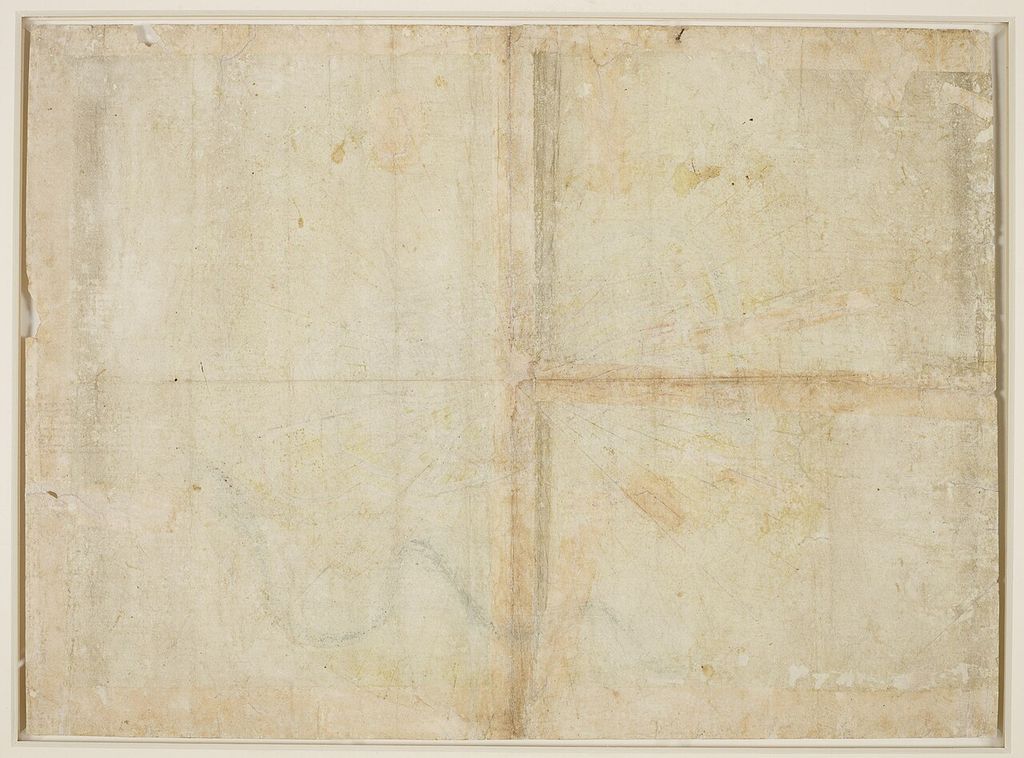
The sheet does not record the bearing of every segment. Length alone cannot determine whether the next street turns ten degrees or forty. The working sketches are remarkably informative, but they cannot generate the finished plan by themselves. Additional compass observations, another lost record, an earlier local plan, sighting from fixed points, memory or graphic adjustment must have contributed.
That missing information is one reason the popular recipe—Leonardo paced every street, used a compass and plotted the results—is too certain. Pacing is plausible and discussed in modern scholarship, and he demonstrably recorded distances. Compass survey was within contemporary practice and appears in related work. The precise instrument, sequence and complete set of observations for Imola do not survive. [6] [8]
A Spanish study proposes a more specific reconstruction. Pilar Chías Navarro argues that Leonardo combined lengths along the principal streets with angular sightings from the tower of the Palazzo Comunale, then used a traverse around the perimeter to check the partial measurements. She compares the procedure with the anonymous 1503 plan of Aranda de Duero, for which measurement from the tower of Santa María is better documented. [14] The comparison is useful because it places Imola within a shared Iberian and Italian culture of urban survey rather than treating its geometry as an isolated miracle. It remains a reconstruction: no surviving Imola field sheet labels the Palazzo Comunale as the observation station, and analogy with Aranda cannot supply the lost bearings. The proposal narrows the practical possibilities without turning them into a witnessed itinerary.
From dimensions to an overhead cityThe transformation from field notes to RCIN 912284 required a consistent framework. Incised stylus lines helped construct the circle and radiating divisions before ink fixed them. Chalk laid out forms that could be adjusted. Ink established boundaries and labels; wash separated blocks, water, earth and fortification.
The circular coordinate system recalls Leon Battista Alberti's mid-fifteenth-century description of Rome. Alberti explained how orientations and distances from a centre could be recorded numerically on graduated circular scales and reconstructed without a surviving picture. His work, and the wider Italian culture of architectural survey, supplied an important precedent for translating measured urban space into an orthogonal plan. [6]
Leonardo's map is often said to use Alberti's method. The association is persuasive at the level of circle, direction and coordinate thought, but the evidence is incomplete. The Imola street sketches do not contain radial coordinates from one station, and the complicated city network would require far more observations than a few monuments. The wall might have been surveyed as a traverse, measuring successive lengths and changes of direction. Interior streets could have been assembled from connected dimensions and selected fixed points. [6] [10]
The result is ichnographic or orthogonal: buildings and blocks are represented by their horizontal footprint rather than by picturesque façades. A viewer does not look diagonally across rooftops. This choice sacrifices the immediately recognisable profile of a church or palace in order to preserve relation, distance and route.
Measurement did not eliminate design
Modern overlays confirm the map's broad accuracy while exposing divergence. The wall, street structure and major sites correspond closely enough for the city to be recognised and analysed. They do not align at every point. The History of Cartography notes that the preparatory sketches lack street bearings and that several differences in the finished sheet—especially the curved principal street—appear to improve the map's organic coherence. Street widths and block texture are simplified for legibility. [6]
These changes are not merely failures. A map must select and clarify. If every alley retained its variable width at this scale, the urban system would become difficult to read. Enlarging routes makes circulation visible. Smoothing a block can separate it from the street. The map's usefulness depends partly on departures from literal ground shape.
At the same time, formal preference can distort evidence. The circular frame makes the city feel whole and centred. Flowing streets give its quarters a coordinated rhythm. The plan communicates Imola as a bounded body, not simply as a collection of measured fragments. Leonardo's artistry did not disappear when he adopted an overhead projection; it moved into line weight, colour, spacing and organisation.
That distinction corrects the idea that a “scientific” map ceases to be an image. Measurement constrains the representation, but the maker still decides what to include, how to classify it and how clearly to depart from visual appearance.
How accurate is the map?Scale estimates vary because the map is not uniformly scaled and because different comparisons use different control points. The Imola municipal interpretation gives an approximate scale of 1:4,300. A 2023 cartometric study, matching seventy points within the historic walls to OpenStreetMap data and applying a Helmert transformation, calculated about 1:4,640 and a rotation of thirteen degrees relative to a modern north-up map. [5] [7] [8]
That study reported a root-mean-square positional error of 12.8 metres, with the largest distortions in the south-western and south-eastern parts of the plan. The figure is impressive for a sixteenth-century urban image, but it needs context. Researchers must decide which old and modern features correspond; streets and buildings have changed; paper can deform; and the analysis excluded the less easily matched territory outside the wall. [8]
“Accurate to 12.8 metres” would therefore be misleading if applied to every point. Root-mean-square error summarises a set of selected correspondences after mathematical fitting. Local scale and orientation vary. The study confirms substantial geometric performance while also quantifying the unevenness visible in overlays.
The two scale estimates should not be forced into one supposedly exact original ratio. They arise from different methods. The responsible conclusion is that the map operates at roughly one to 4,500 and preserves the central city with remarkable but non-uniform positional accuracy.
The Rocca and the logic of defence
The fortress anchors the military reading. Imola's Rocca had been altered under earlier rulers and remained the strongest single defensive complex. Leonardo shows its relation to wall, ditch, gate and adjacent streets, allowing an engineer to think beyond the isolated building.
A fortress succeeds or fails through approach, fields of fire, supply, escape and the urban fabric around it. The overhead plan makes those relations inspectable. It can disclose a route blocked by a choke point or a quarter that gives an attacker cover. Even without a surviving scheme drawn over the map, its format creates a base on which intervention can be discussed.
The surrounding road network also places defence at a territorial scale. Borgia's patent required inspection of multiple strongholds, and Manuscript L records bearings and distances among towns. The Imola sheet joins a local plan to that wider network by writing directions towards Bologna, Castel San Pietro, Faenza, Forlì and other places around its margin. Some of those stated bearings and distances are inaccurate, another reminder that precision varies across layers of the work. [3] [6]
Was it made from an older map?
Imola already had engineers and defensive records. Danesio Maineri worked for the Sforza and was sent to the city in 1472–73 in connection with the Rocca and walls. A later hypothesis proposes that Leonardo used or revised an earlier survey by Maineri. The possibility is reasonable: a military engineer entering a fortified city would seek existing drawings, local measurements and knowledgeable officials rather than begin from ignorance. [5]
The surviving documents do not prove that Maineri produced a full plan of the internal street system. They mention drawings in decisions about defence. The History of Cartography observes that this gives no reason to assume an interior survey. Leonardo's preparatory quarter sheet, characteristic inscriptions and handling support substantial authorship of the surviving map. [6]
The choices are therefore not “entirely invented alone” or “merely coloured an older map”. Leonardo may have combined new field measurement with local records. Renaissance technical work commonly accumulated across makers. Until a specific base plan is identified, its extent remains unknown.
Not the first map seen from aboveDescriptions of Imola as the first modern map or first overhead city plan compress a long history into a slogan. Ancient and medieval cultures produced plans, cadastral diagrams and measured descriptions. The marble Forma Urbis Romae represented buildings in plan more than a millennium earlier. Medieval Italian communes recorded measured urban boundaries even when the result remained textual rather than graphic. [6]
Fifteenth-century artists and architects transformed city representation. Alberti developed coordinate survey. Francesco Rosselli's Florence and Jacopo de' Barbari's immense view of Venice combined topographic information with elevated perspective and civic meaning. A late-fifteenth-century plan of Pisa includes streets and fortifications, though large areas are inaccurate or invented. [6]
Imola's importance becomes clearer within that company. It is an exceptionally early, detailed and accomplished measured orthogonal plan of a whole urban street system. It suppresses façades more thoroughly than contemporary bird's-eye views and integrates streets, walls, fortress and approaches in a consistent operational image. Those are precise historical claims. Whether they satisfy an undefined category called “modern” depends on which modern quality—projection, measurement, accuracy, purpose or publication—a writer chooses.
The map also remained a manuscript sheet. It did not circulate through print to establish a school of urban cartography. Later sixteenth-century plans confronted similar survey problems through their own institutional and technical routes. Imola can be innovative without becoming the single origin of modern mapping.
Later images make Leonardo's choice visible
Imola's municipal library sets Leonardo's plan beside two later representations of the city. Sforza Carradori's drawing, probably made between 1580 and 1585, uses an axonometric view in which buildings retain three-dimensional mass. Angelo Filippo Gratia da Matelica's engraved plan of 1673 adopts a bird's-eye position and makes numerous churches and private buildings recognisable through their individual forms. [4]
The comparison shows what Leonardo removed. A raised viewpoint can identify a church by its façade, dome or tower, but it also hides one route behind another and changes apparent dimensions with distance. RCIN 912284 refuses those scenic advantages. Most blocks become coloured ground figures, and streets retain their value as connected intervals. Its abstraction is therefore purposeful rather than merely austere: the image gives up architectural portraiture to make movement, enclosure and spatial relation easier to examine.
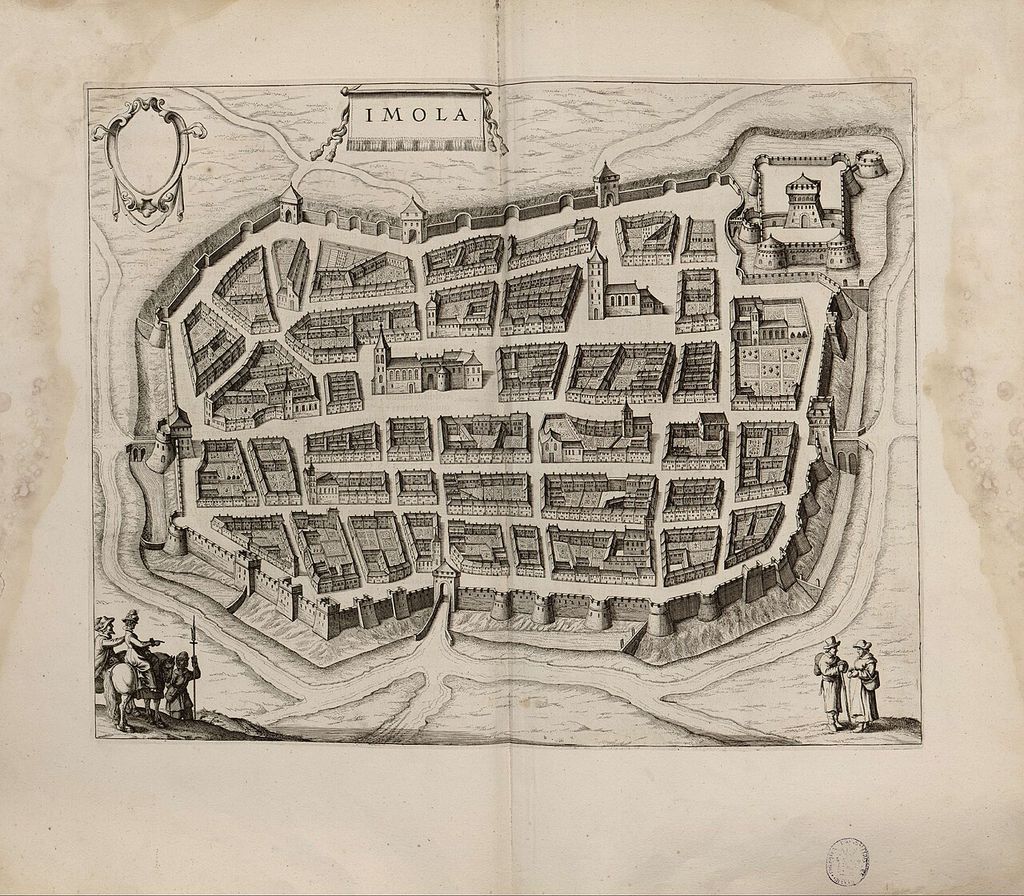
The later views also warn against treating urban cartography as a simple march from perspective to plan. Different formats survived because they answered different questions. A civic image that displayed monuments and social identity could favour bird's-eye representation; an engineer concerned with walls, routes and measured relations could favour orthogonal projection. Leonardo's sheet is historically exceptional, but its format did not make every other way of picturing a city obsolete.
A map rediscovered through reproduction and local scholarshipThe map's present fame is partly a modern history of access. Imola's municipal bibliography records scholarship from the early twentieth century to the present and identifies a 1901 French publication on Leonardo's canals as the first faithful black-and-white reproduction of the sheet. Mario Baratta discussed it for the Italian Geographical Society in 1911; a colour facsimile appeared in the Royal Commission's 1941 volume of Leonardo's geographical drawings. The quarter sketches on RCIN 912686 entered discussion later: Carlo Pedretti announced their identification in 1955. [12]
That sequence matters because claims about Leonardo's method changed when the preparatory evidence became available. A finished plan alone invites speculation about a single ingenious instrument or a lost aerial vision. The measured quarter sheet anchors interpretation in repeated work at street level while also revealing the missing bearings and construction problems. Later GPS and cartometric comparisons then asked a different question—how the historic geometry behaves against selected modern control points—without turning those modern measurements into Leonardo's own procedure. [7] [8] [12]
Local scholarship has preserved disagreements as well as admiration. The bibliography includes studies supporting and criticising the proposal that Danesio Maineri supplied an earlier base, work on the Santerno's meanders, research on the Rocca, and successive Royal Collection catalogues. [12] The history of interpretation is therefore not a settled procession towards one verdict. It is an expanding test of what can be inferred from the finished sheet, its companion drawing, archival documents and the altered city itself.
Why “satellite-like” is both helpful and wrong
The popular comparison recognises a real visual effect. A present-day reader can follow streets in RCIN 912284 without learning the conventions of a perspective city view. The buildings do not lean towards an imagined observer, and the whole enclosure seems available at once.
But a satellite records reflected energy from above. Leonardo's map is a model built from terrestrial fragments. No human eye saw Imola in this form. The overhead viewpoint is a mathematical and graphic fiction that removes obstruction: roofs no longer hide streets, walls do not block the quarter behind them, and distance is not compressed by perspective.
Calling it a “satellite map” can also imply photographic objectivity. RCIN 912284 widens, curves, colours, simplifies and centres. Those decisions make the plan intelligible and rhetorically coherent. Its achievement is more impressive when the construction is acknowledged: Leonardo generated a usable view that nature did not provide.
The map as a tool of powerAn urban plan changes who can know a city. Routes and weak points formerly learned by walking or held in local memory become portable. A ruler, commander or engineer can inspect relations from elsewhere, compare proposals and issue instructions. The same abstraction that clarifies space also makes it governable.
Borgia's state was new, coercive and unstable. His patent empowered Leonardo to enter fortresses, demand help and direct other engineers. The map belongs to that apparatus even if its precise briefing is lost. Its beauty should not detach it from reconnaissance conducted for a conquering regime. [3]
At the same time, the object exceeds one political moment. It records Imola before major later alterations and preserves evidence about its quarters, defences and river environment. Local historians can compare it with later views; cartographic historians can test its geometry; viewers can see how field measurements become an argument about urban form.
A measured city, deliberately composed
RCIN 912284 is neither an impossible photograph before flight nor a decorative fantasy. Its companion sheet proves sustained measurement. Its mismatches prove that measurement was not the whole process. Leonardo joined dimensions, possible bearings, prior knowledge, geometric construction and graphic judgement to make a city legible from nowhere and useful somewhere else.
The map's historical force lies in that combination. It transforms walking through Imola into a portable system of relations. It gives walls and streets a common scale, places a fortress within an urban body and connects the city to a contested territory. It is exceptionally accurate for its date and purpose, but it also edits reality. The most revealing way to read it is not as the first version of a technology Leonardo could not possess, but as a Renaissance solution to the difficult problem of seeing, measuring and controlling a whole city at once.
Continue exploring Leonardo
Explore Leonardo’s works and designs
| Name | Date | Medium |
|---|---|---|
| A Map of Imola | 1502 | Drawing |
| Adoration of the Magi | About 1482 | Painting |
| Annunciation | About 1472 | Painting |
| Bacchus | Around 1517–1520 | Painting |
| Benois Madonna | Around 1478–1480 | Painting |
| Crossbow | 1485-1490 | Drawing |
| Diving Suit | — | Drawing |
| Flying Machine | — | Drawing |
| Ginevra de’ Benci | c. 1474/1478 | Painting |
| Head of a Woman (Turin) | Source-led range: 1478-1485, c. 1483-1485 or 1480s | Drawing |
| Helicopter | — | Drawing |
| Horse and Rider | — | Sculpture |
| La Bella Principessa | — | Painting |
| La Belle Ferronnière | c.1490–1497 | Painting |
| La Scapigliata | 1492–1501 ca | Painting |
| Lady with an Ermine | c. 1490 | Painting |
| Landscape Drawing for Santa Maria della Neve | Fifteenth century; inscription dated 5 August 1473 | Drawing |
| Leda and the Swan | — | Painting |
| Leonardo's Catapult Designs | late fifteenth century | Drawing |
| Leonardo's Designs for Milan Cathedral | 1487–90 | Architecture |
| Leonardo's River-Lock Drawing | late fifteenth century | Drawing |
| Leonardo's Romorantin Palace Project | 1517–18 | Architecture |
| Leonardo's Self-Propelled Cart | late 1470s–1480s | Drawing |
| Machine Gun | — | Drawing |
| Madonna Litta | Mid-1490s | Painting |
| Madonna of the Carnation | Around 1475 | Painting |
| Madonna of the Yarnwinder | — | Painting |
| Mary Magdalene | — | Painting |
| Mona Lisa | 1503 / 1519 | Painting |
| Ornithopter | — | Drawing |
| Parachute | — | Drawing |
| Portrait of a Lady: The Historic Leonardo Attribution | late fifteenth century | Painting |
| Portrait of a Man in Red Chalk (Self Portrait) | 1517/1518 or c. 1517-1518 | Drawing |
| Portrait of a Musician | About 1485 / first Milan period | Painting |
| Portrait of Isabella d’Este | Around 1499/1500 | Drawing |
| Profile of an Ancient Captain | c. 1475–1480 | Drawing |
| Rearing Horse and Mounted Warrior | First half of the 16th century | Sculpture |
| Saint Jerome in the Wilderness | About 1480–1482 / 1481–1482 | Painting |
| Saint John the Baptist | Around 1508–1519 | Painting |
| Salvator Mundi | — | Painting |
| Study of Hands | c.1480 | Drawing |
| The Baptism of Christ | About 1470–75 | Painting |
| The Battle of Anghiari | — | Painting |
| The Burlington House Cartoon | About 1506–8 | Painting |
| The Fetus in the Womb | c. 1511 | Drawing |
| The Last Supper | 1495–1498 in the Museo del Cenacolo Vinciano object table | Painting |
| The Sforza Horse Monument | 1480s–1499 | Sculpture |
| The Trivulzio Monument | c. 1506–13 | Sculpture |
| The Virgin and Child with Saint Anne | Around 1503–1519 | Painting |
| Triple Barrel Cannon | — | Drawing |
| Virgin of the Rocks | — | Painting |
| Vitruvian Man | Generally associated with Leonardo’s Milanese years, around 1490; exact dating remains cautious | Drawing |
| Wreath of Laurel, Palm, and Juniper with a Scroll | c. 1474/1478 | Drawing |
Frequently Asked Questions
Discussion
Which part of the evidence changes the way you read A Map of Imola? The article sets surviving material beside later interpretation; share the distinction that matters most to you.
Reader Insights
What detail in the images or drawings is easiest to miss on a first viewing?
How does leonardo in cesare borgia's romagna alter your understanding of this subject?
Where does the article leave a question open rather than presenting a settled answer?
Join the Conversation
Share your reading of A Map of Imola below.
References
- Royal Collection Trust, “A map of Imola,” RCIN 912284. View Source
- Royal Collection Trust, “Sketches of the street plan of Imola; Notes on mathematics,” RCIN 912686. View Source
- Biblioteca comunale di Imola, “In Romagna con Leonardo”. View Source
- Biblioteca comunale di Imola, “La città in una mappa”. View Source
- Biblioteca comunale di Imola, “Pianta di Imola divisa in quattro settori,” exhibition panel. View Source
- David Friedman, “Portraying the City in Early Modern Europe,” in The History of Cartography, vol. 3, part 1 (University of Chicago Press, 2007), 680–704. View Source
- Warsaw University of Technology, record for Paweł Pędzich, “Cartometric analysis of selected works by Leonardo da Vinci,” Polish Cartographical Review 55, no. 1 (2023), 1–10. View Source
- Paweł Pędzich, “Cartometric analysis of selected works by Leonardo da Vinci,” Polish Cartographical Review 55, no. 1 (2023), 1–10. View Source
- Treccani, “Leonardo da Vinci,” Enciclopedia Italiana. View Source
- Museo Galileo/Treccani, “Il Rinascimento. Gli ingegneri del Rinascimento: dalla tecnica alla tecnologia,” Storia della Scienza. View Source
- Comune di Imola, Rocca Sforzesca: documento di indirizzo alla progettazione. View Source
- Biblioteca comunale di Imola, “La mappa di Imola di Leonardo da Vinci”. View Source
- Max Planck Institute for the History of Science, Leonardo's Intellectual Cosmos exhibition catalogue. View Source
- Pilar Chías Navarro, “Leonardo da Vinci: cartografía, territorio y paisaje,” in Luis Ramón-Laca, ed., Leonardo da Vinci: Perspectiva y visión (Universidad de Alcalá, 2020), 21–33. View Source